
Why market-data timestamps and freshness matter
Distinguish event, exchange, provider, receipt, and display times so a current-looking number is not mistaken for executable or contemporaneous data.
Read articleChartCompass research
Sourced explanations and practical research methods for individual investors and active traders.
Distinguish event, exchange, provider, receipt, and display times so a current-looking number is not mistaken for executable or contemporaneous data.
Read article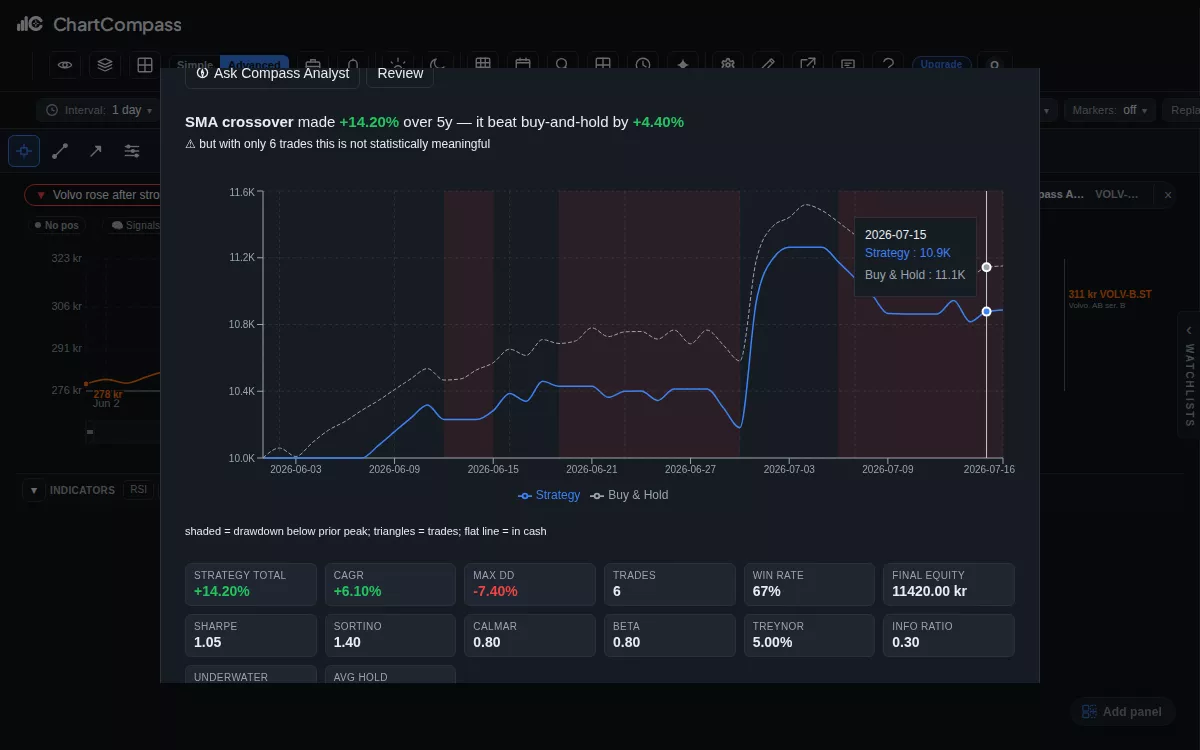
A trustworthy backtest preserves the information available at each date, exposes assumptions and costs, and survives tests it was not optimized to win.
Read articleUse crack spreads as transparent market indicators, then account for crude quality, product yields, operating costs, utilization, and location.
Read article
A source-led map of the interacting supply, demand, infrastructure, and expectation variables behind European wholesale gas prices.
Read articleUnderstand what average true range measures, how it can scale a hypothetical risk unit, and why it cannot guarantee exits or define suitability.
Read articleLook through ticker counts to economic exposures, then use transparent shocks to find where correlated losses and liquidity needs may cluster.
Read articleA practical checklist for verifying generated market explanations, separating sources from synthesis, and reviewing data handling before sharing sensitive context.
Read articleA practical evidence ladder for describing what moved, what changed nearby, and how much confidence a causal explanation deserves.
Read articleSeparate reported results, management's forward ranges, market expectations, and subsequent analyst revisions before explaining a reaction.
Read articleStart with how each company earns cash, then normalize accounting definitions, capital needs, cycles, and risks before comparing valuation multiples.
Read articleUse price behavior, company economics, and dated events as separate lenses that answer different questions instead of forcing them into one score.
Read articleTurn a list of tickers into a dated research queue with a question, evidence, invalidation condition, next catalyst, and explicit status.
Read article