Menu
Charts

Charts that start simple and grow with you

Begin with a clean price line. When you are ready, switch to candles, add indicators and draw your own levels, all on the same chart.

ChartCompass demonstration switching a Volvo chart from line to candles and adding the RSI indicator pane.
Switch chart types and add indicators in a click · isolated demonstration data.

Start simple, add more when you are ready

Switch from a line to candles, Heikin-Ashi or any of 18 chart types. Add any of 42 indicators and draw with 30 tools, from trend lines to Fibonacci levels.
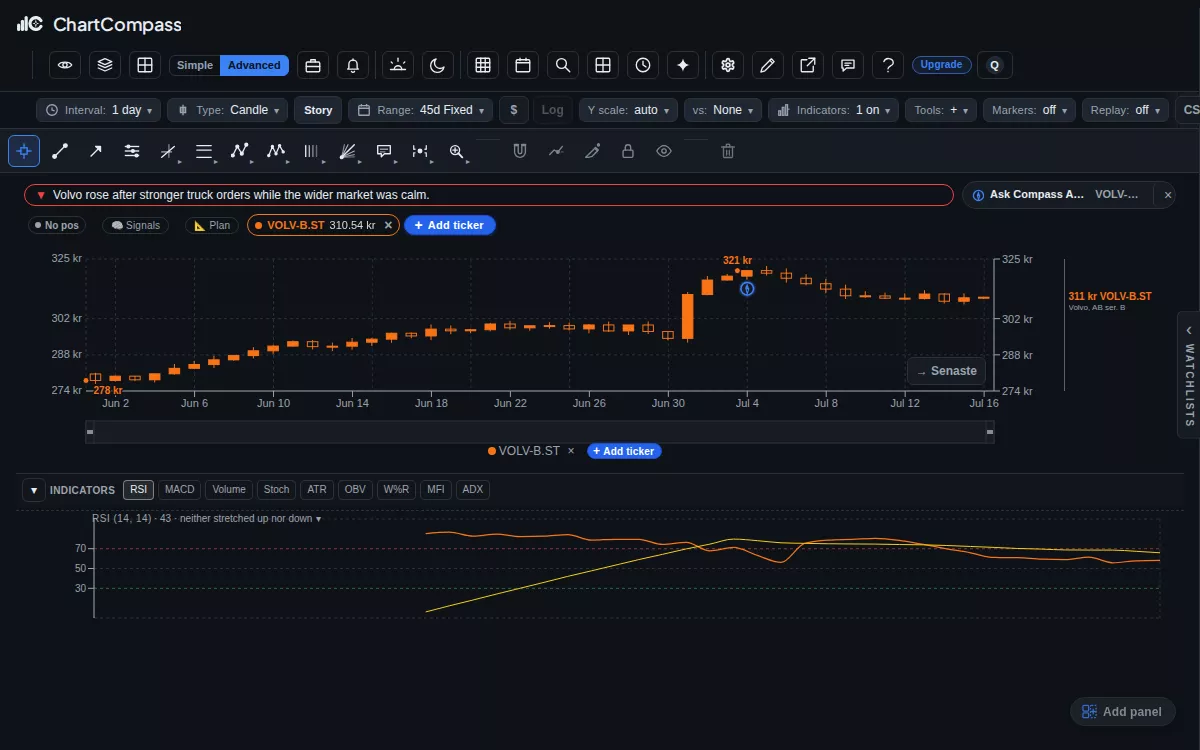
ChartCompass demonstration switching a Volvo chart from line to candles and adding the RSI indicator pane.
Switch chart types and add indicators in a click · isolated demonstration data.

Every big move marked

The largest jumps and drops carry a marker. Click one to read why the stock moved that day. See move explanations
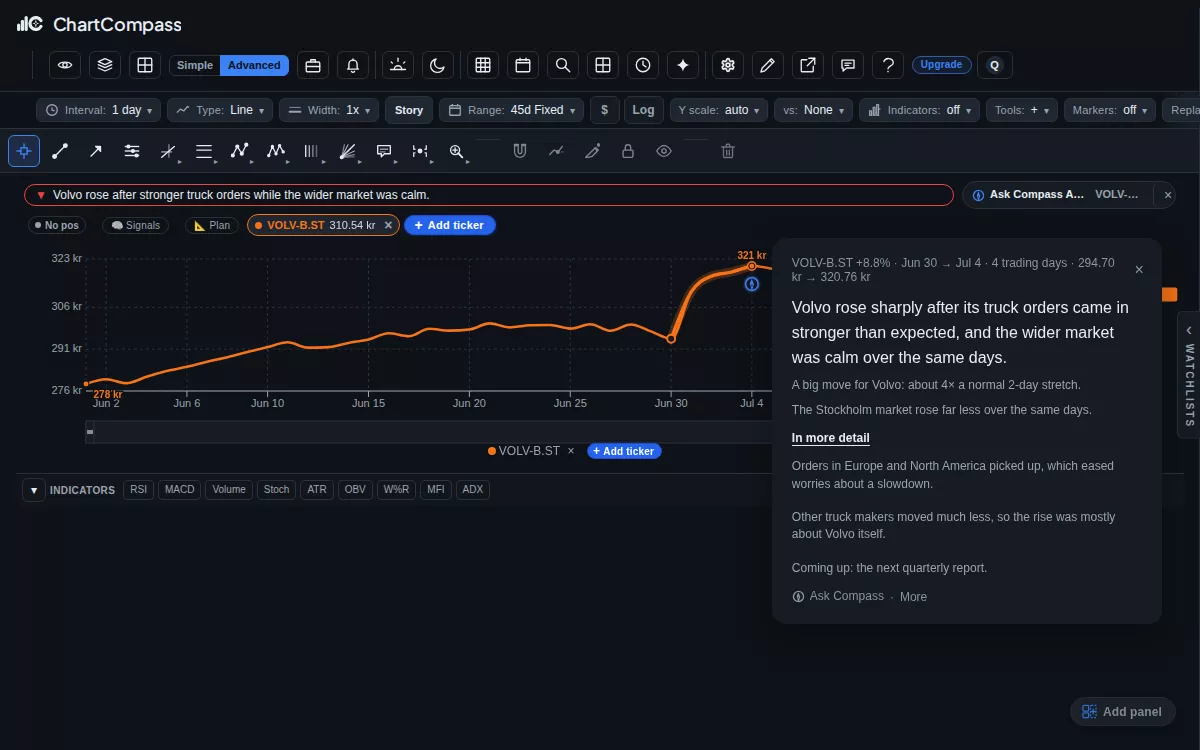
ChartCompass demonstration: a Volvo chart marks a sharp rise, and clicking the marker opens a plain-words explanation of why it moved.
Click a marked move to read why it happened · isolated demonstration data.

Side by side, and on your phone

Compare several stocks in one view, up to 16 charts at once, and keep a readable chart on a phone-sized screen.
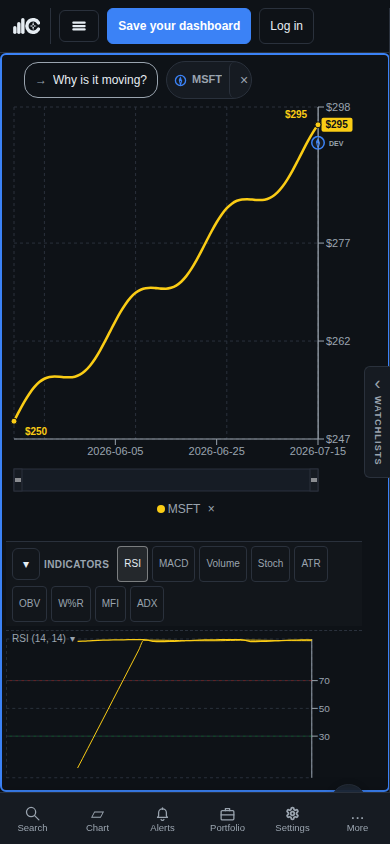
ChartCompass phone demonstration with a readable Volvo chart, a marked move, indicators, and compact bottom navigation.
The chart-first workspace remains usable on a phone-sized viewport.

Open a chart

Free: every chart type and drawing tool, 3 indicators per chart and 3 charts side by side. Essential: 5 indicators per chart, 4 charts side by side and 5 saved layouts.

Open ChartCompass