Menu
Limited beta · guest mode available

Explain a move. Find an opportunity. Test an idea.

ChartCompass brings charts, source-aware market explanations, deterministic opportunity review, and transparent strategy tests into one private workspace. Start with a job, see the evidence and limitations, then decide your next step.

Access summary No credit card · Account optional to explore · No live order placement

Access remains controlled. You can explore in guest mode without a card; creating an account saves private workspace data across devices.

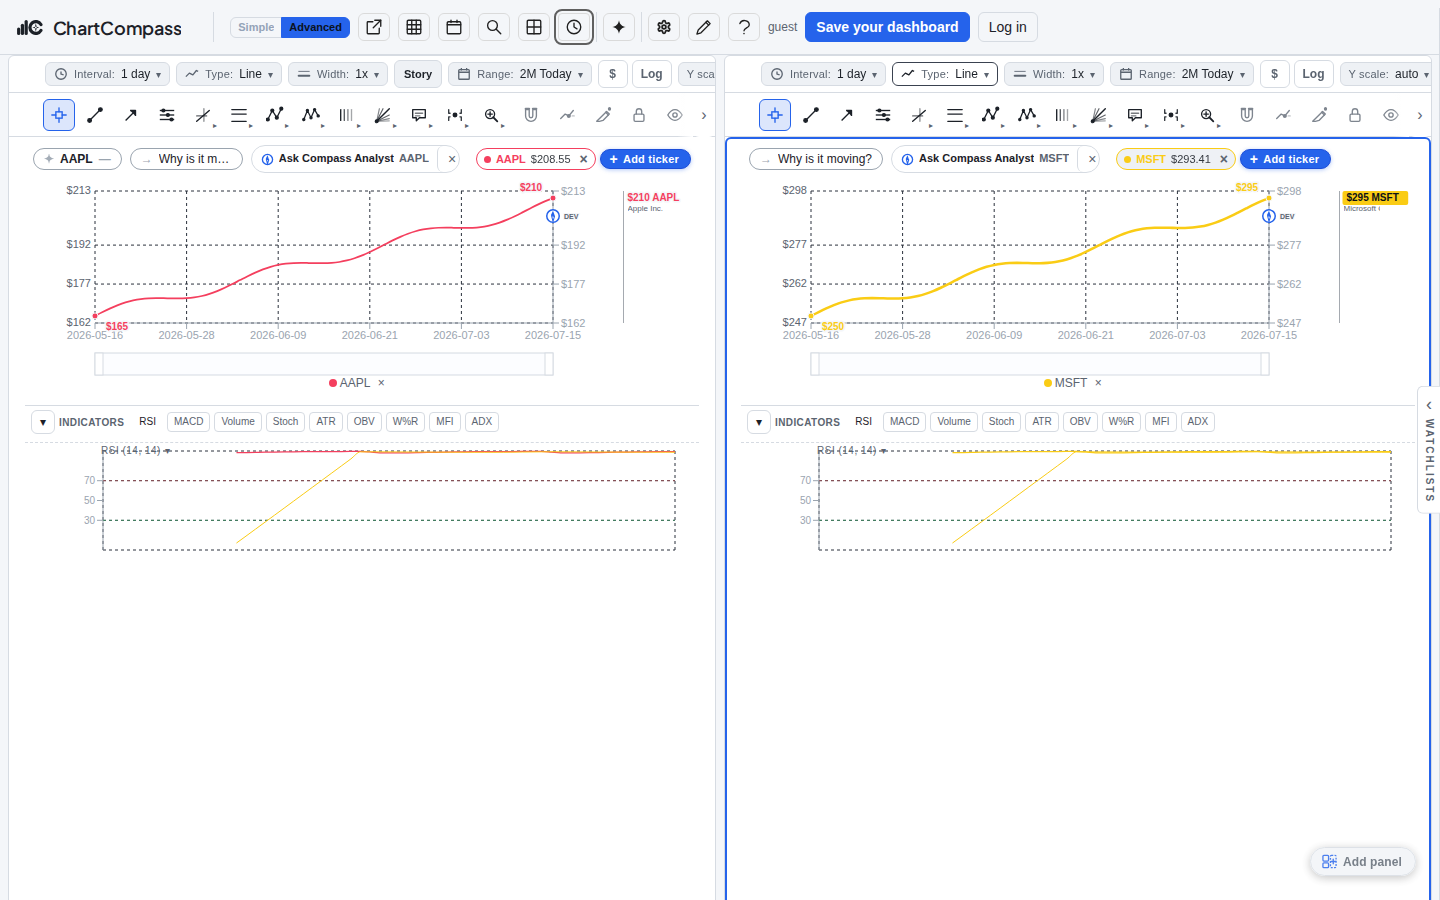
ChartCompass demonstration workspace with side-by-side AAPL and MSFT charts, indicators, research actions, and visible price scales.
Isolated demonstration data · Two ChartCompass workspaces compared side by side.

Start with the outcome you need

Each path ends at a visible result, not a click or loading screen. You can skip the guide and use the chart directly.

ChartCompass demonstration workspace with side-by-side AAPL and MSFT charts, indicators, research actions, and visible price scales.
Isolated demonstration data · Two ChartCompass workspaces compared side by side.

Explain a move

Choose a visible ticker and open a significant move. ChartCompass shows the complete move, a plain-language explanation, and direct source state when reliable reporting exists.

First useful outcome No background explanation call is made just because a chart loads. If reporting is unavailable, the result says so instead of inventing a cause.
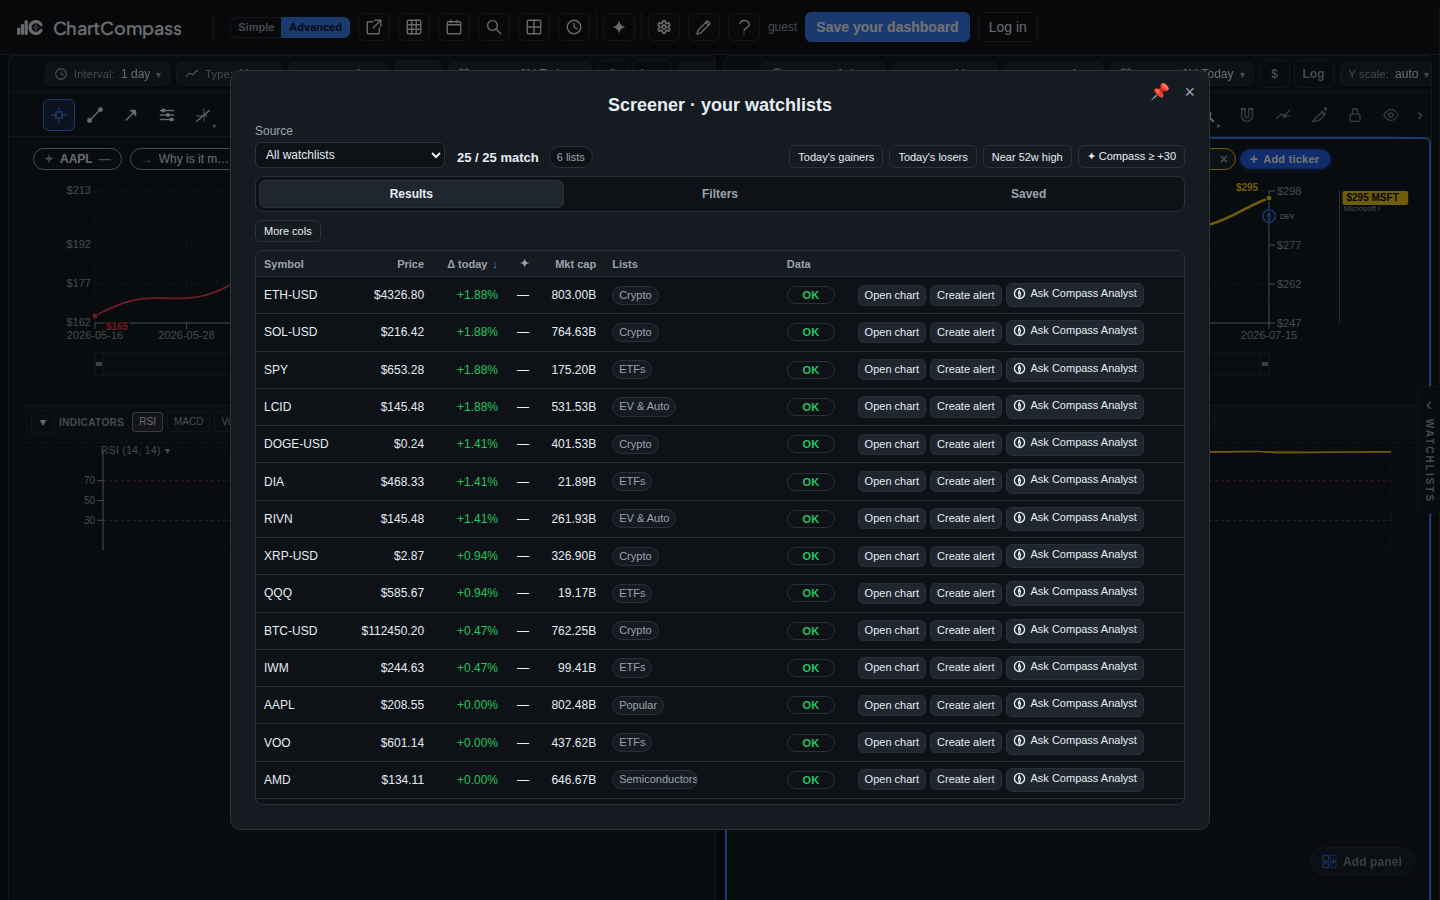
ChartCompass Screener demonstration showing a reproducible watchlist universe, visible source lists, market columns, and per-symbol research actions.
A bounded demonstration universe in the ChartCompass Screener; values are synthetic and are not live results.

Find an opportunity

Review a clearly temporary starter universe or one of your own research views, then open a deterministic candidate and its dated company snapshot.

First useful outcome Ranking and sorting make no AI call. A quiet or incomplete universe stays quiet rather than producing a made-up candidate.

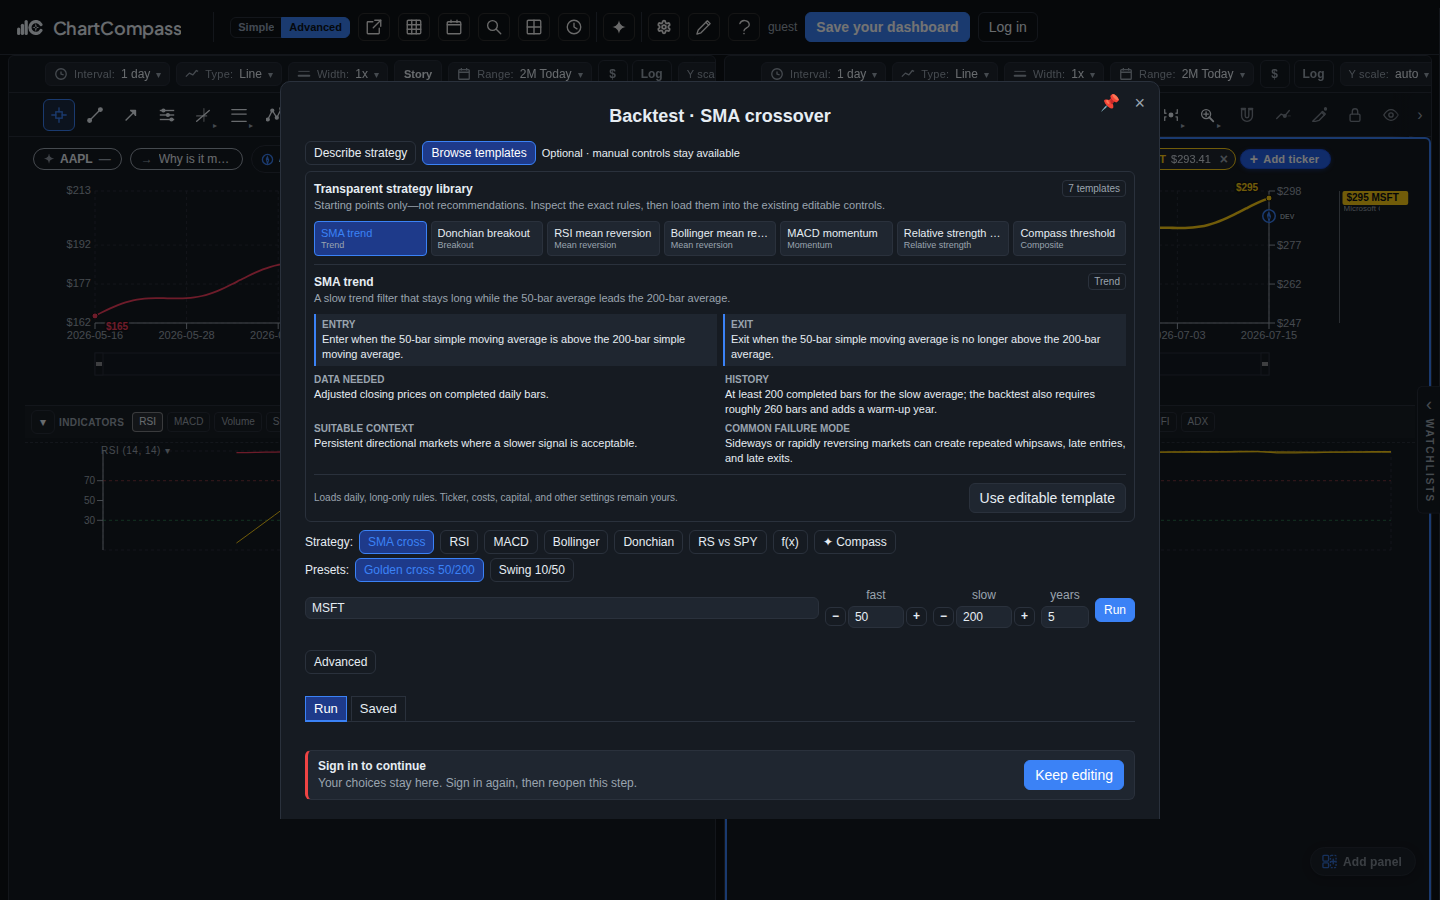
ChartCompass Backtest demonstration with an inspectable strategy-template library, explicit entry and exit rules, data needs, context, and failure modes.
An editable ChartCompass strategy starting point with assumptions and failure modes kept visible; demonstration only.

Test a strategy

Start from an editable rule, run a bounded backtest, and inspect the main result together with costs, sample context, and limitations.

First useful outcome Backtests are historical tests, not forecasts. Monitoring is observational by default, and ChartCompass does not place live orders.

Useful only when the limits are visible

ChartCompass is research software, not personalized investment, tax, or legal advice. Evidence and controls stay next to the work.

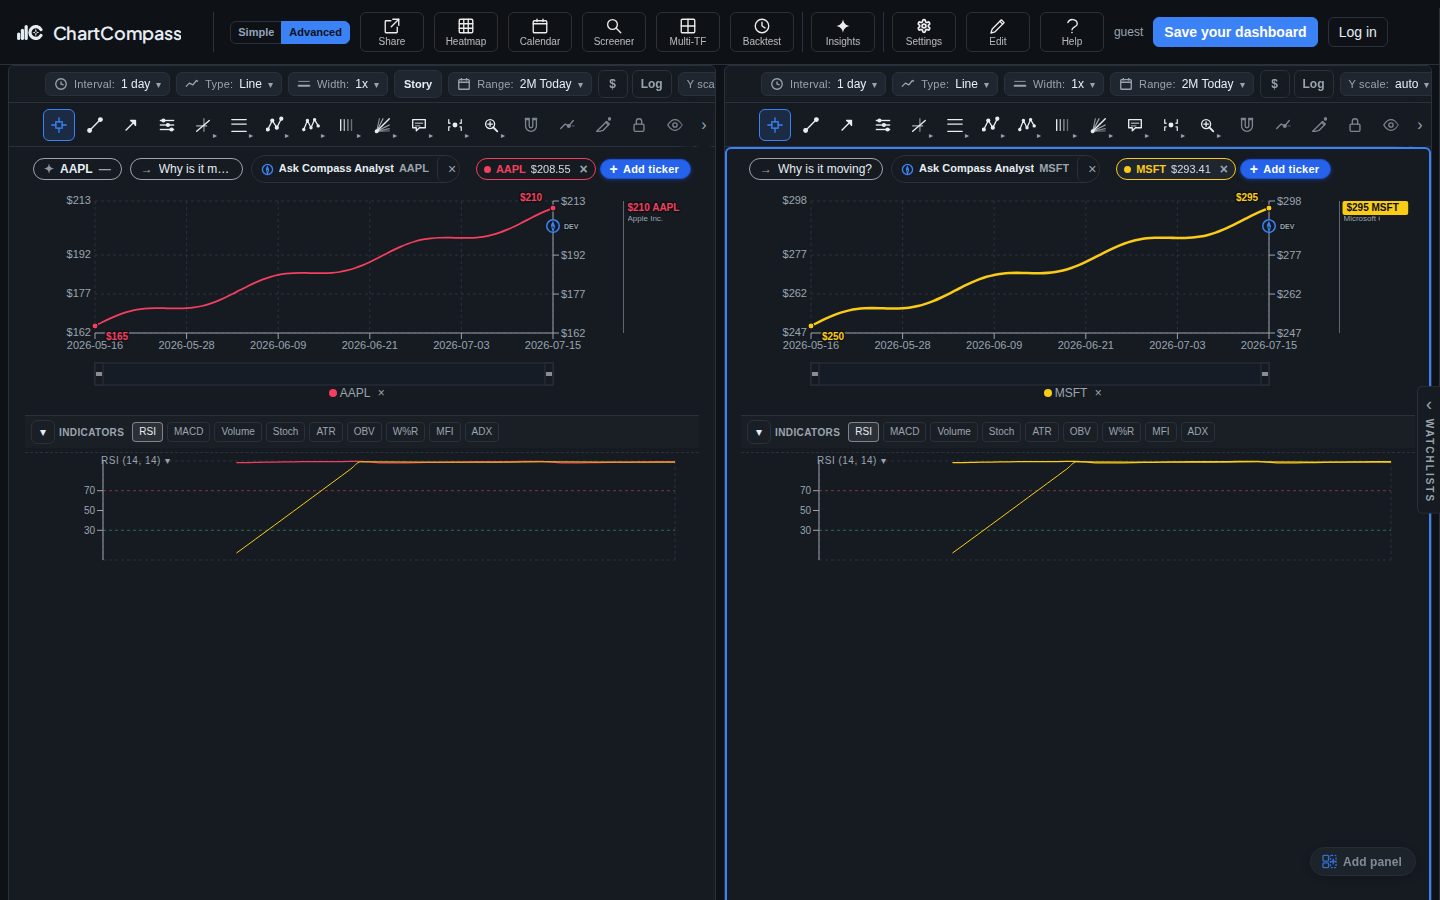
ChartCompass light demonstration workspace comparing AAPL and MSFT charts with technical indicators and research controls.
The same research workspace in ChartCompass light mode, using isolated demonstration data.

AI is explicit and bounded

AI helps explain selected results and questions. Deterministic scores, rankings, and backtests do not become recommendations, and generated text can be incomplete or wrong. Check the cited facts before acting.

Market data has visible limits

Freshness, history, and coverage depend on the instrument and configured provider. Cached, delayed, partial, stale, and unavailable states are labelled; no surface promises a live quote when it cannot verify one.

Private work stays under your control

Minimal product-usage measurement records coarse launch progress, never prompts, answers, symbols, portfolios, strategies, notes, account identifiers, IP addresses, or full user agents. It can be turned off without losing a feature.

Accounts are recoverable

Use password sign-in, a single-use email link, password recovery, or optional two-factor authentication. Settings exposes session revocation, exports, privacy controls, and account deletion with a recovery grace period.

Privacy and account control

Raw launch-measurement events expire after 30 days. Their random journey ID expires within 24 hours, longer-lived aggregates contain no journey ID, and groups smaller than five stay hidden. Account exports and deletion remain separate, deliberate controls.

In the app, use Settings → Privacy to turn measurement off or delete the current raw journey. Use Settings → Account for workspace export, active sessions, and account deletion; Decision Copilot also provides its own detailed data export and per-item deletion controls.

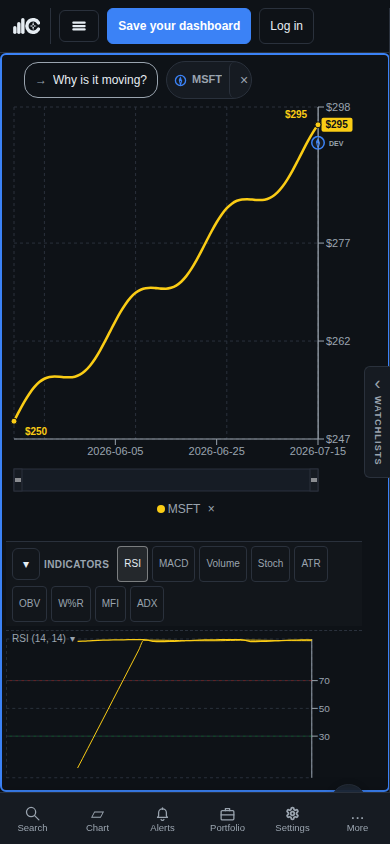
ChartCompass phone demonstration with a readable MSFT chart, indicators, watchlist rail, and compact bottom navigation.
The chart-first workspace remains usable on a phone-sized viewport.

Plans & pricing

The plan table below is loaded from the same server catalog used by the app. Showing the catalog does not broaden beta access or authorize a public launch. Stripe shows the final amount and cadence before a payment is confirmed.

ChartCompass Backtest demonstration with an inspectable strategy-template library, explicit entry and exit rules, data needs, context, and failure modes.
An editable ChartCompass strategy starting point with assumptions and failure modes kept visible; demonstration only.

Help and service interruptions

For product guidance, open Help inside the app. If a market-data, AI, email, account, or billing action fails, keep the visible message and time, avoid repeated submissions when a write or payment may still be processing, and retry only when the surface offers it.

What an incident update includes

A service notice names the affected surface, UTC start time, what still works or a safe workaround, and the next update time. ChartCompass support will never ask for your password, session cookie, API key, full database, private prompt, or unredacted account screenshot.

ChartCompass Screener demonstration showing a reproducible watchlist universe, visible source lists, market columns, and per-symbol research actions.
A bounded demonstration universe in the ChartCompass Screener; values are synthetic and are not live results.

Explore first. Save your workspace when it helps.

Open ChartCompass →