
Free
$0
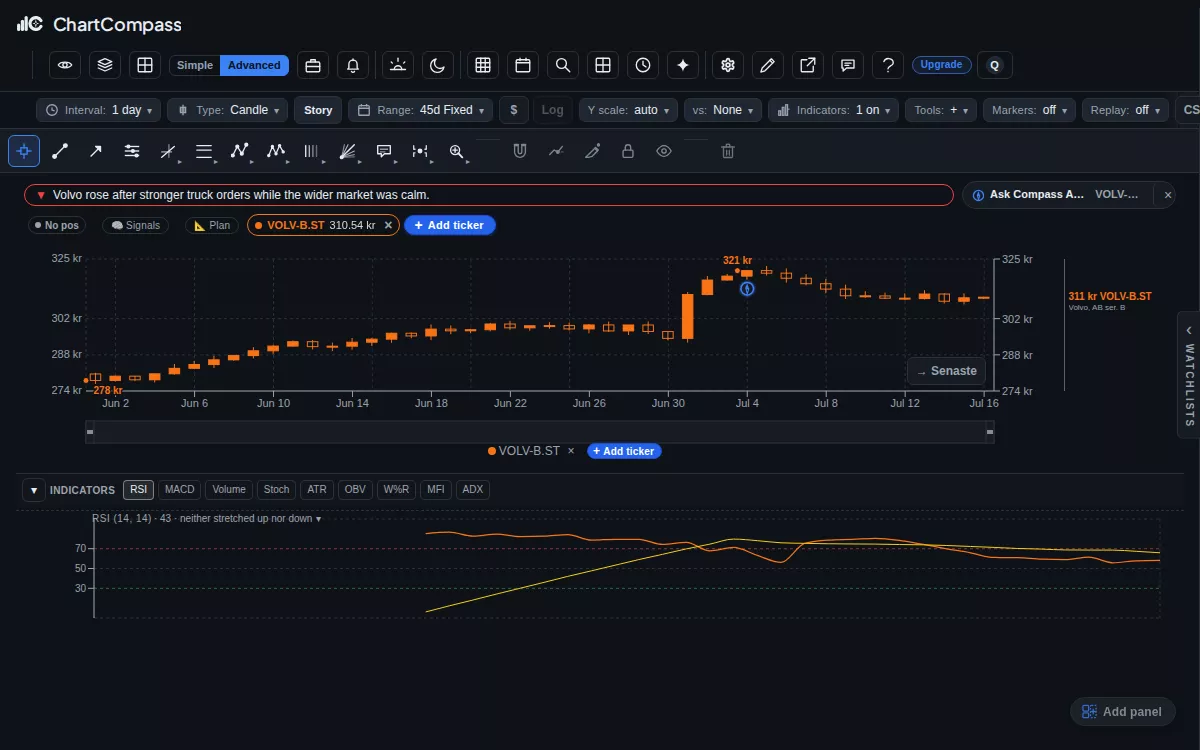
Daily explanations, move explanations on the chart, and the weekly email.
Move explanations on the chart, the daily explanation and the weekly email are free. Paid plans add your own questions, more charts and deeper tools.
$0
Daily explanations, move explanations on the chart, and the weekly email.
Most popular
$14.95 / month
Ask your own questions and follow-ups, 30 a day.
$34.95 / month
100 questions a day, a screener for your watchlists and your own indicators.
$69.95 / month
Backtests with walk-forward and Monte Carlo, risk tools and SMS alerts.
$239.95 / month
Up to 16 charts in one view, API access and the highest limits.
Yes. Cancel under Plan & Billing in your account settings. Your paid plan stays on until the end of the period you already paid for.
Choose Annual billing above to see each plan's full yearly charge and what it saves compared with twelve monthly payments. Taxes may apply.
No. ChartCompass explains what happened and shows history. It never tells you what to buy or sell.
Stocks on 14 exchanges: the US, Stockholm, Oslo, Helsinki, Copenhagen and 9 more in Europe.