
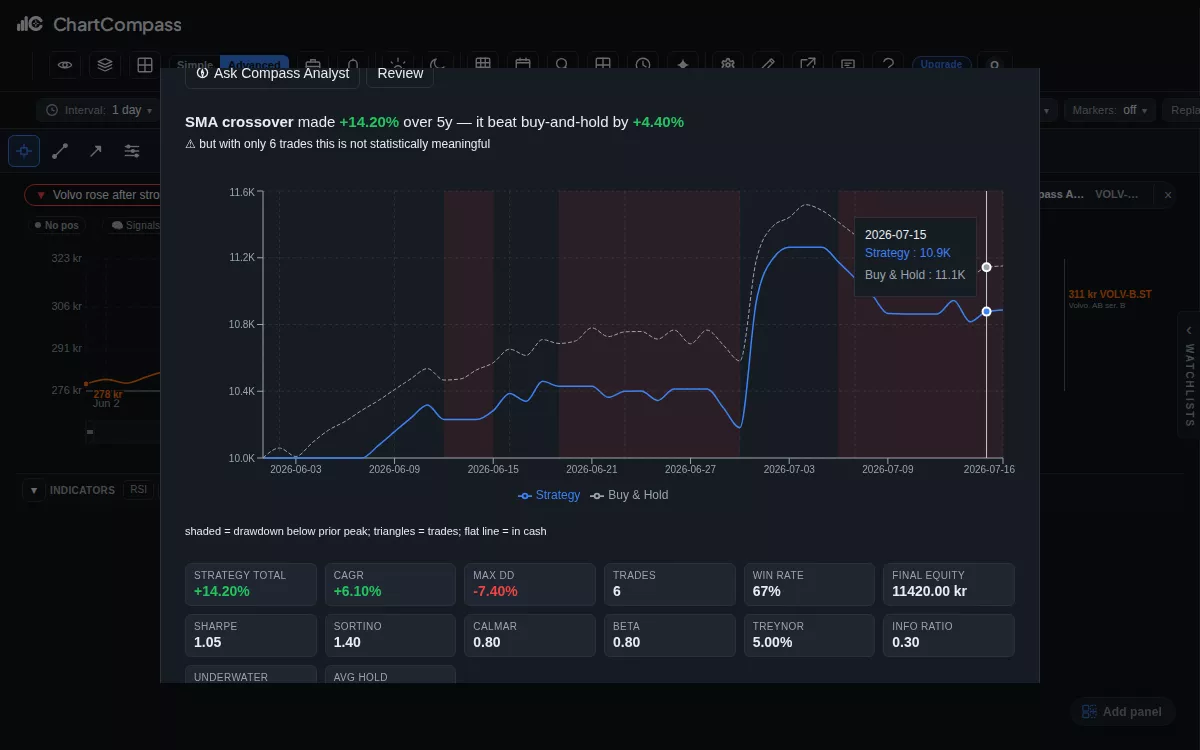
What makes a backtest trustworthy
A trustworthy backtest preserves the information available at each date, exposes assumptions and costs, and survives tests it was not optimized to win.
Read articleChartCompass research
Sourced explanations and practical research methods for individual investors and active traders.
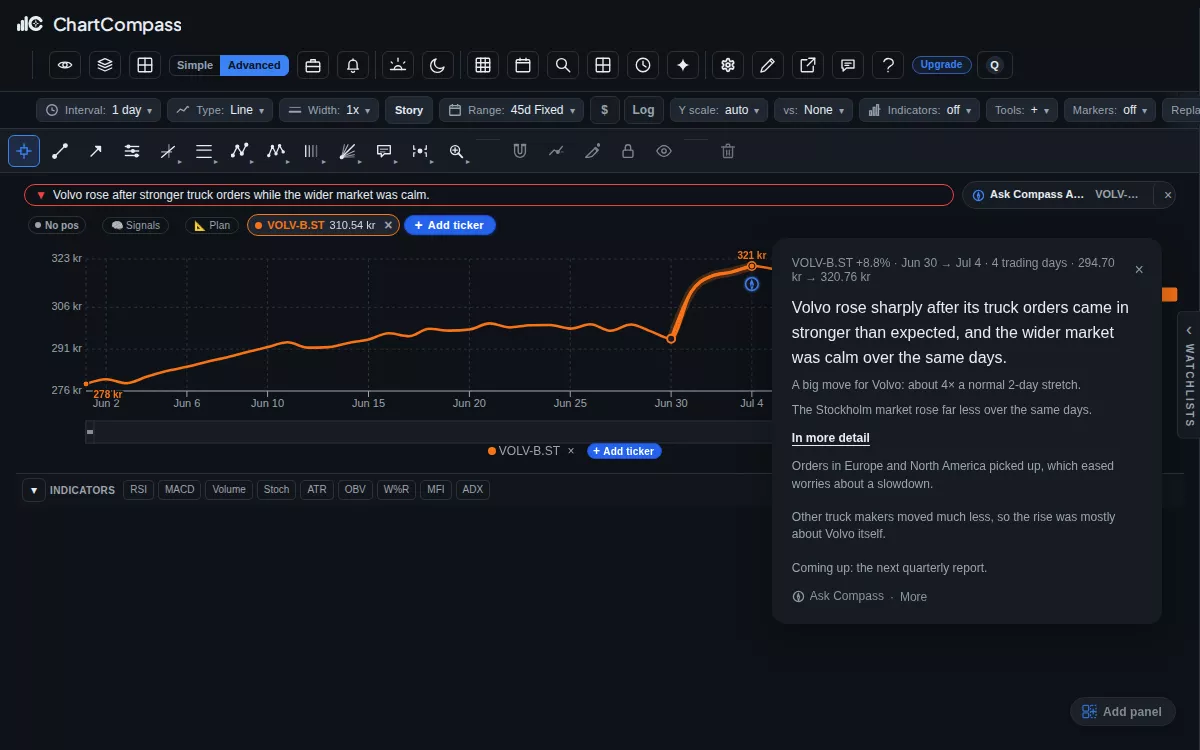
A trustworthy backtest preserves the information available at each date, exposes assumptions and costs, and survives tests it was not optimized to win.
Read articleUnderstand what average true range measures, how it can scale a hypothetical risk unit, and why it cannot guarantee exits or define suitability.
Read articleLook through ticker counts to economic exposures, then use transparent shocks to find where correlated losses and liquidity needs may cluster.
Read articleTurn a list of tickers into a dated research queue with a question, evidence, invalidation condition, next catalyst, and explicit status.
Read article