Zum Hauptinhalt springen
DE
Menü
Product

Start with why your stock moved. Grow into the whole toolkit.

ChartCompass explains big stock moves in plain words, then gives you charts, alerts, backtests and a portfolio view when you want more. Pick a feature to see it in action.

ChartCompass demonstration switching a Volvo chart from line to candles and adding the RSI indicator pane.
Switch chart types and add indicators in a click · isolated demonstration data.

Move explanations

Big jumps and drops are marked on the chart. Click one to read what happened that day, in plain words. See move explanations
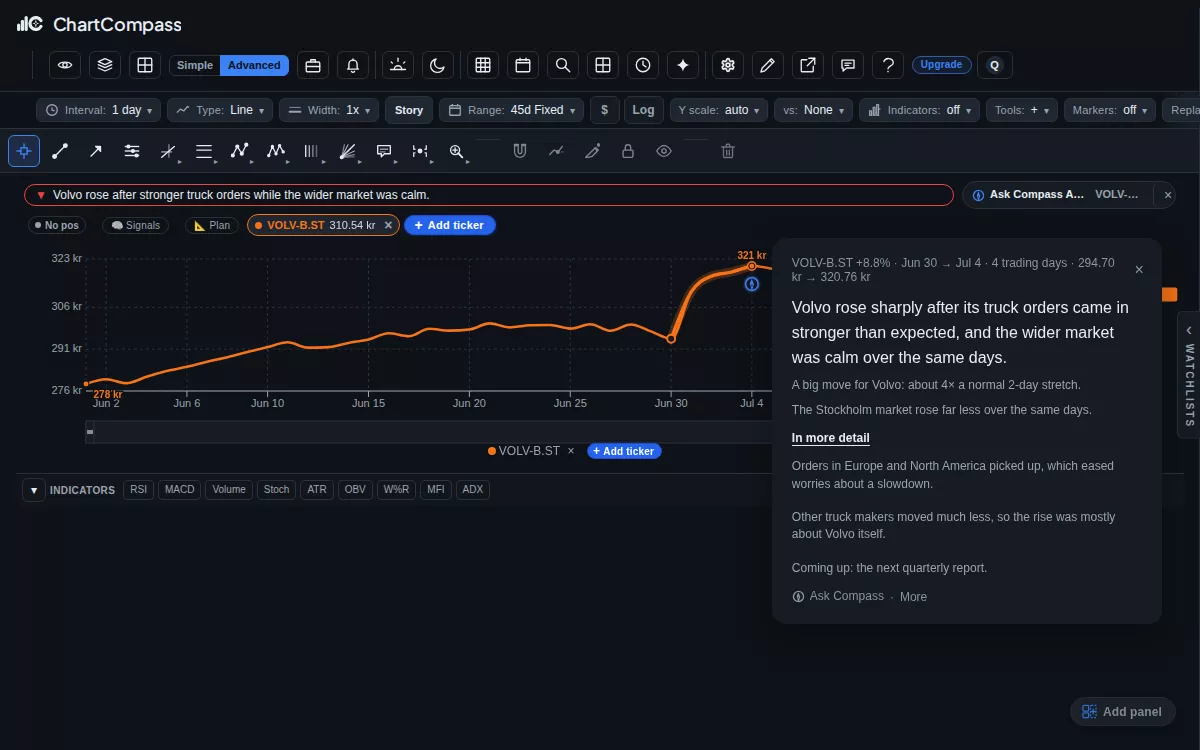
ChartCompass demonstration: a Volvo chart marks a sharp rise, and clicking the marker opens a plain-words explanation of why it moved.
Click a marked move to read why it happened · isolated demonstration data.

Ask Compass and news

Ask about a stock in your own words and read company news next to the chart. See Ask Compass
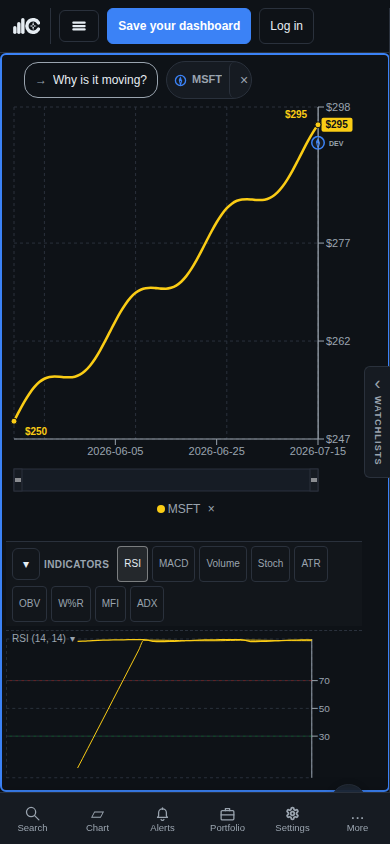
ChartCompass phone demonstration with a readable Volvo chart, a marked move, indicators, and compact bottom navigation.
The chart-first workspace remains usable on a phone-sized viewport.

The weekly email

Every Saturday, why the stocks you follow moved this week. See the weekly email
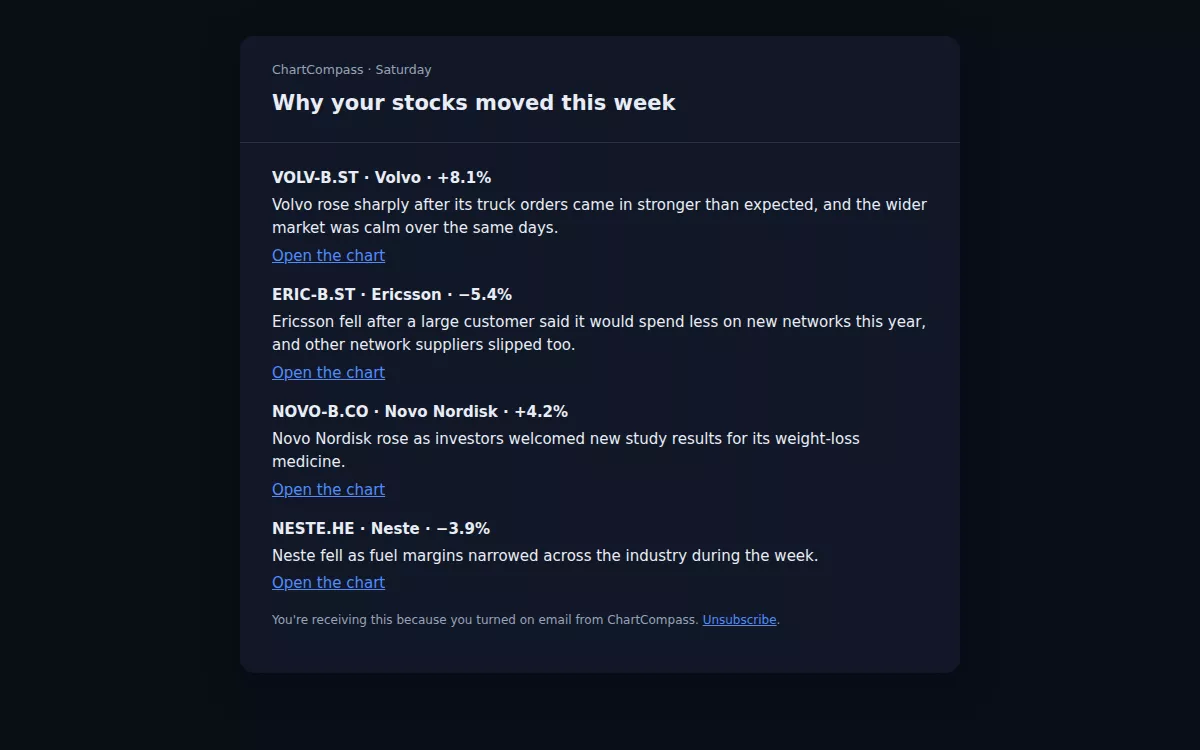
ChartCompass demonstration of the Saturday email explaining in plain words why each followed stock moved this week.
The Saturday email: why your stocks moved this week · demonstration data.

Charts and indicators

18 chart types, 42 indicators and 30 drawing tools, starting from a simple line. See charts
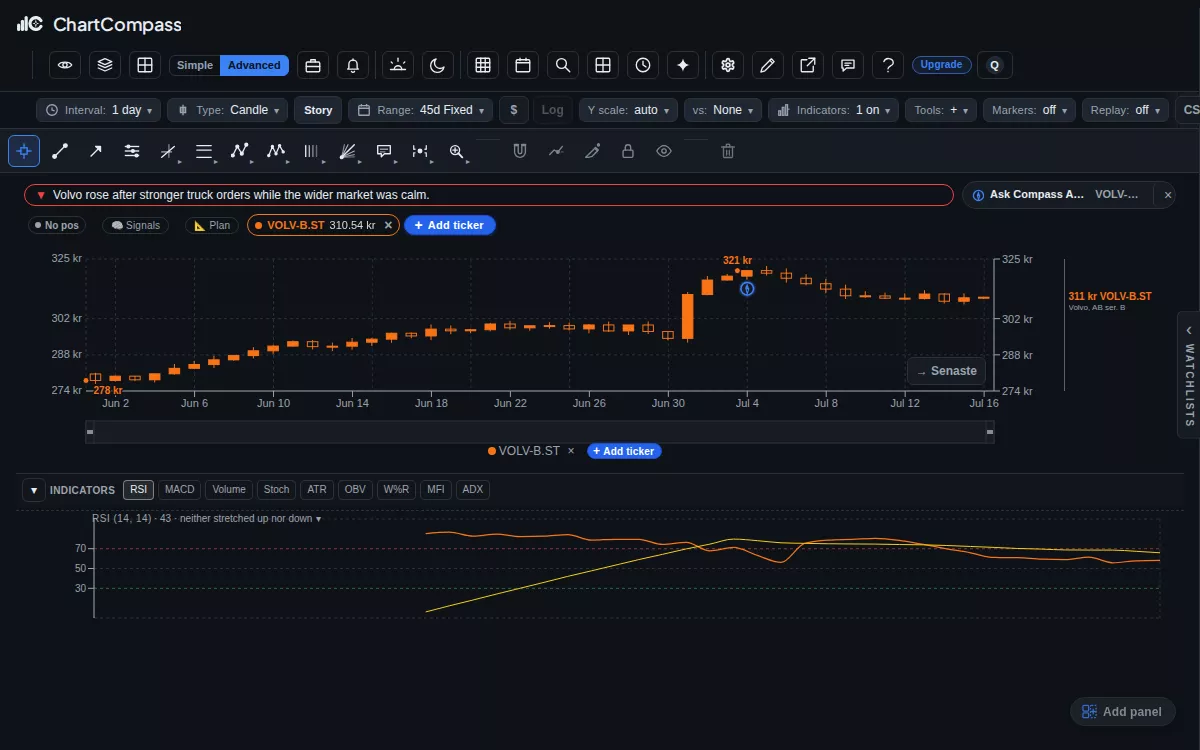
ChartCompass demonstration switching a Volvo chart from line to candles and adding the RSI indicator pane.
Switch chart types and add indicators in a click · isolated demonstration data.

Backtest without code

Describe a strategy in plain words and see how it did in the past, costs included. See backtests
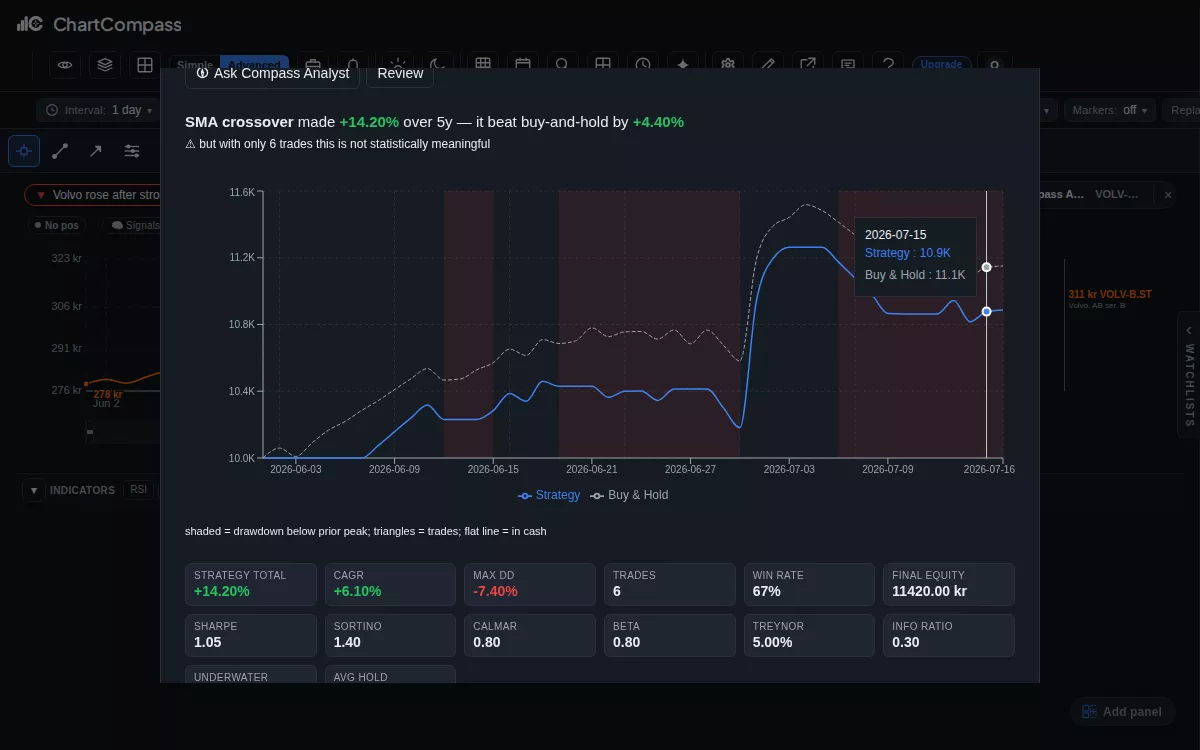
ChartCompass demonstration: a strategy described in plain English becomes editable rules, runs as a backtest, and shows the equity curve and metrics.
Test a strategy without code; results are history, not a promise · demonstration data.

Alerts

Set a price or indicator alert once and hear about it when it fires. See alerts
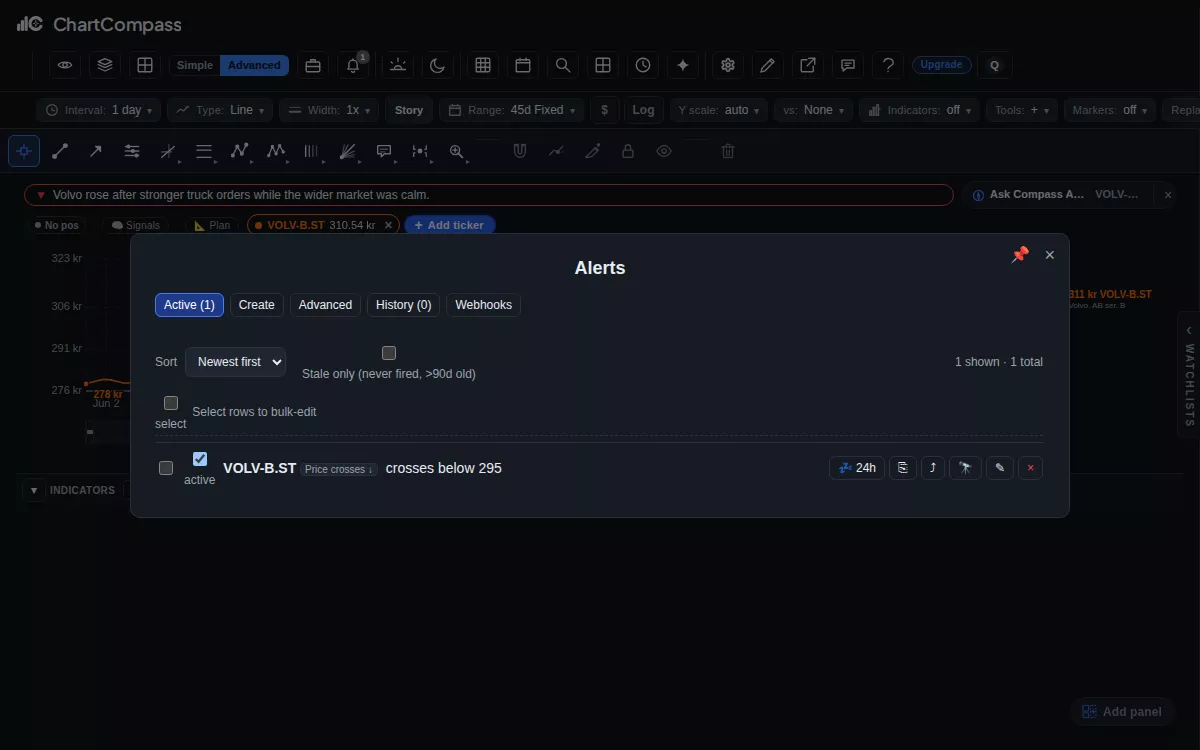
ChartCompass demonstration creating a Volvo alert for the price crossing below a level, delivered as a push notification.
Set an alert once and get notified when it fires · demonstration data.

Portfolio and risk

Import your holdings, see where you are concentrated and keep your tax lots. See portfolio and risk
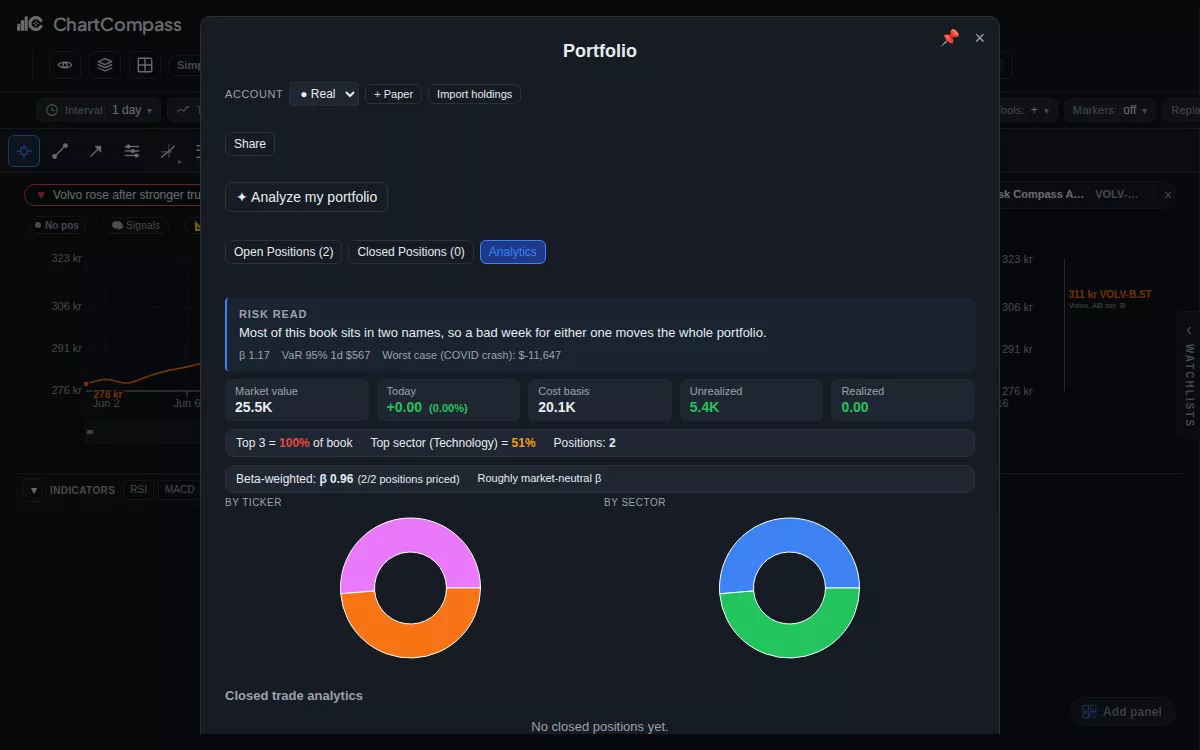
ChartCompass demonstration adding a holding to a portfolio and seeing the concentration and risk summary update.
See concentration and risk as you add holdings · synthetic demonstration book.

Try it on a stock you own

Open ChartCompass