Saltar para o conteúdo principal
PT
Menu
For active traders

Move quickly without hiding the assumptions

ChartCompass helps active traders scan, explain, test, alert, and review from one chart-led workspace while keeping source freshness and uncertainty visible.

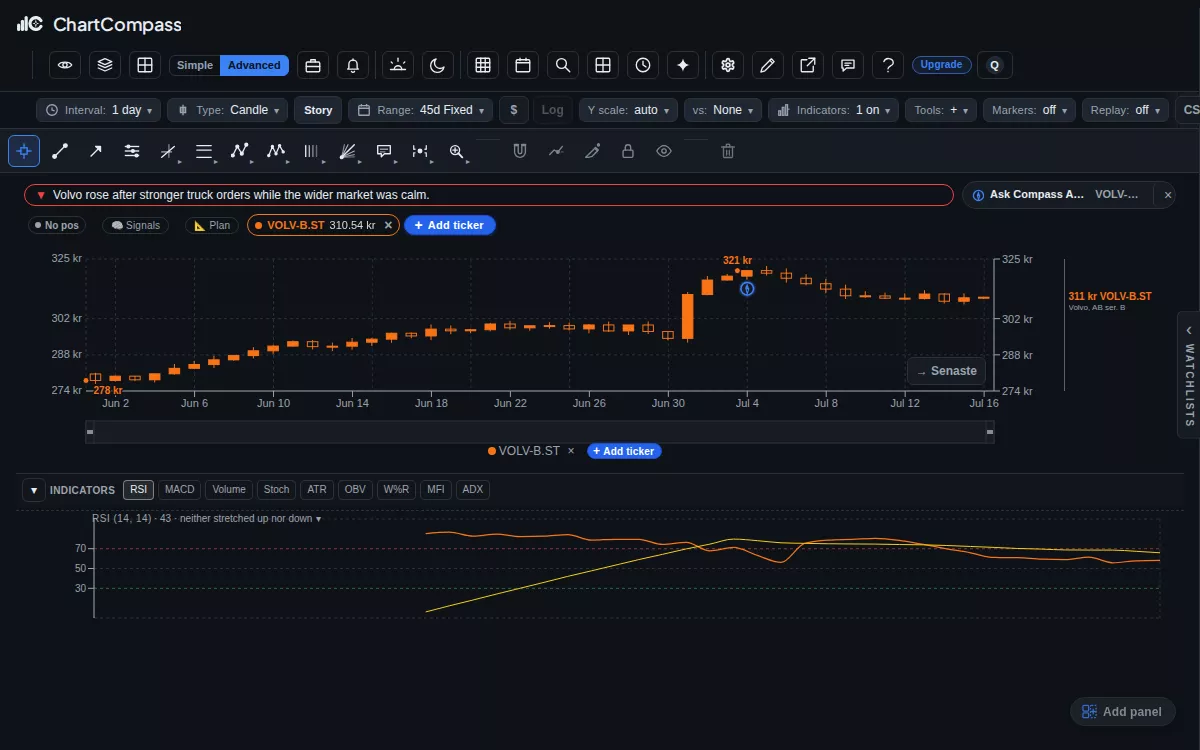
ChartCompass demonstration switching a Volvo chart from line to candles and adding the RSI indicator pane.
Switch chart types and add indicators in a click · isolated demonstration data.

Review the move in context

Start with the exact symbol, interval, time range, price move, volume, and technical state. Then inspect available company, sector, macro, commodity, or news evidence without turning temporal overlap into an unsupported causal claim.
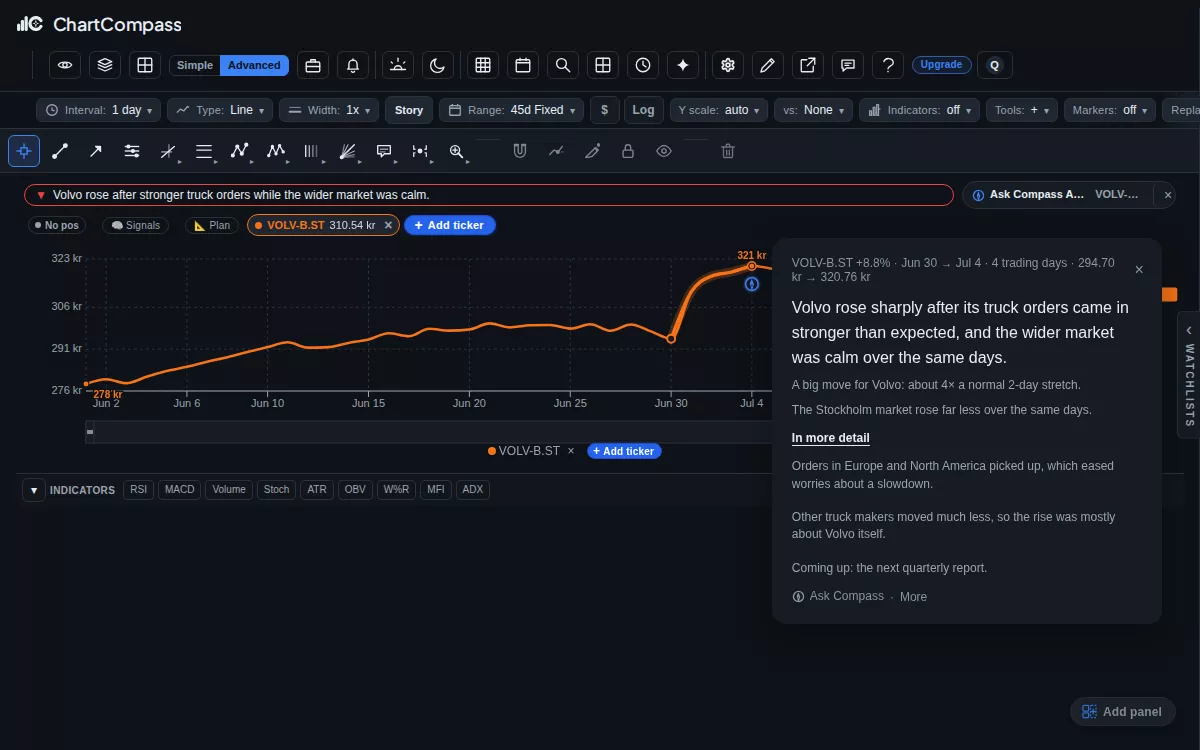
ChartCompass demonstration: a Volvo chart marks a sharp rise, and clicking the marker opens a plain-words explanation of why it moved.
Click a marked move to read why it happened · isolated demonstration data.

Turn conditions into repeatable work

Save layouts, research views, alerts, and strategy definitions so the next review uses the same inputs. Alert previews and strategy summaries expose the trigger, timing, and relevant limits before the workflow is activated.
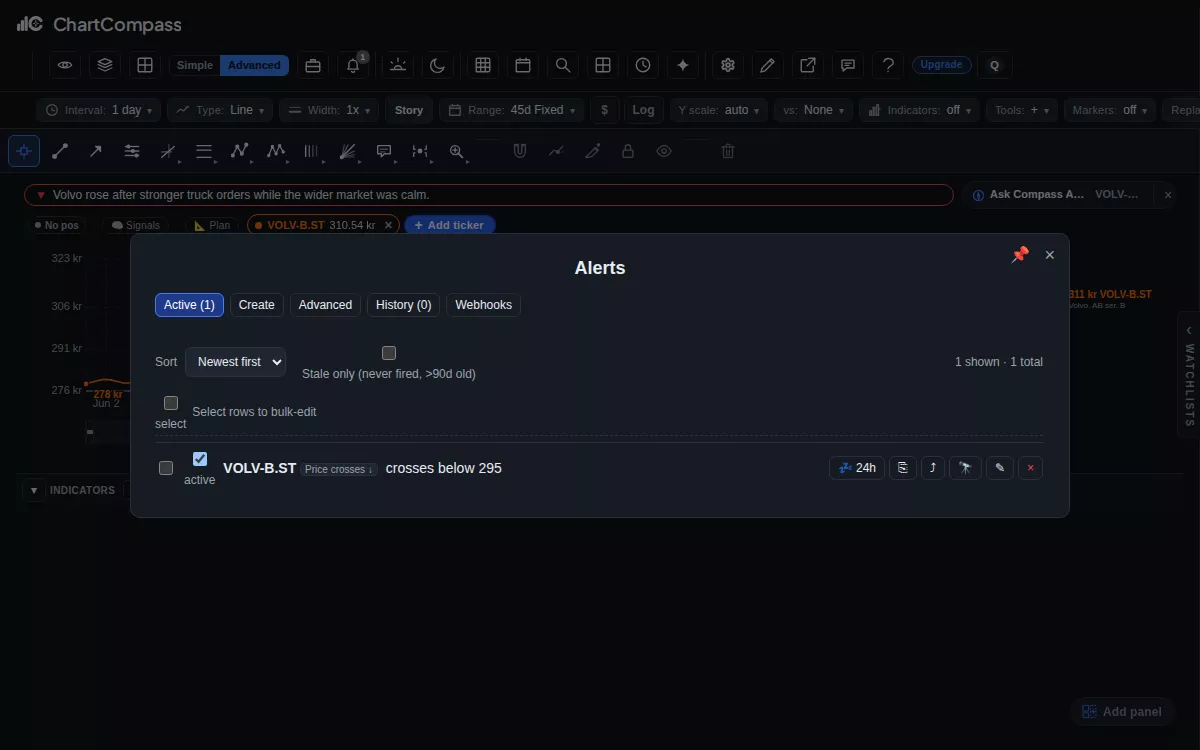
ChartCompass demonstration creating a Volvo alert for the price crossing below a level, delivered as a push notification.
Set an alert once and get notified when it fires · demonstration data.

Test before relying

Historical tests can include costs, parameter sensitivity, walk-forward checks, and adverse scenarios. Sparse data, overfitting, execution differences, and market-regime change remain material limitations.
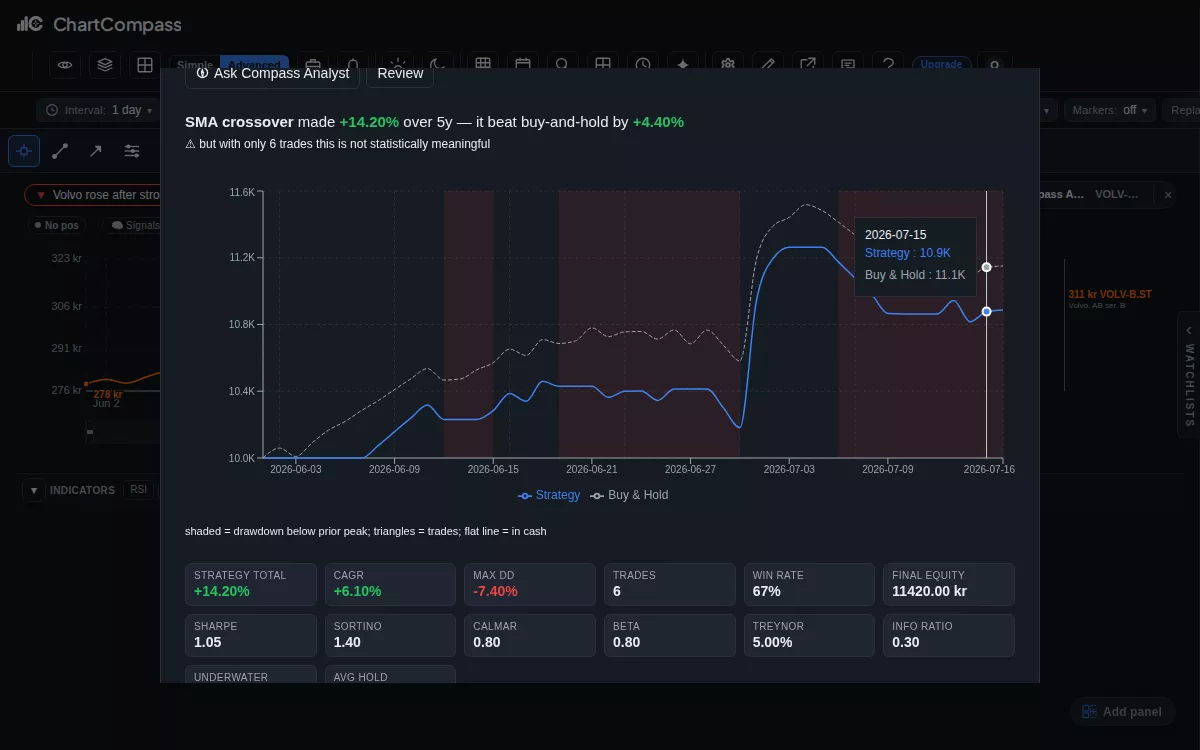
ChartCompass demonstration: a strategy described in plain English becomes editable rules, runs as a backtest, and shows the equity curve and metrics.
Test a strategy without code; results are history, not a promise · demonstration data.

Review outcomes

Decision notes and later outcome windows help compare what was expected with what happened. ChartCompass supports analysis and paper workflows; it is not a broker and does not place live trades.
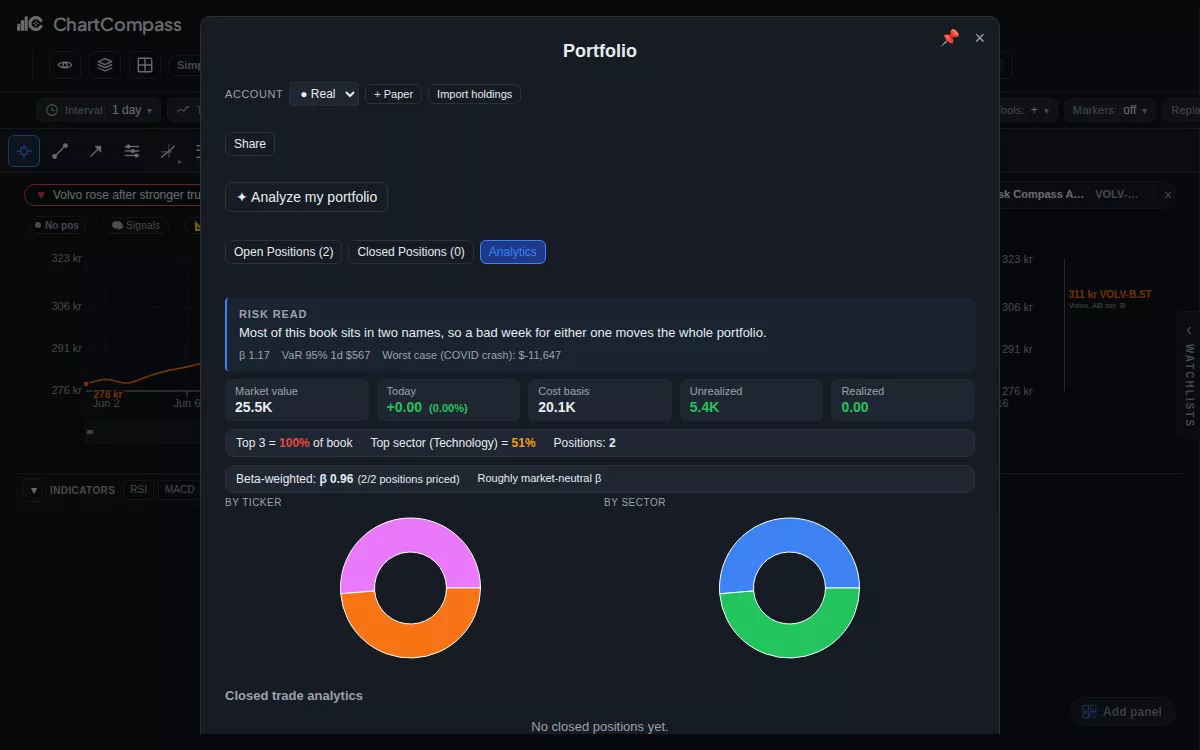
ChartCompass demonstration adding a holding to a portfolio and seeing the concentration and risk summary update.
See concentration and risk as you add holdings · synthetic demonstration book.

Keep the next move in context

Open ChartCompass