Vai al contenuto principale
IT
Menu
Move explanations

Click a big move. Read why it happened.

Every chart marks its biggest jumps and drops. One click opens a short explanation of what happened that day, written for people who are new to stocks.

ChartCompass demonstration: a Volvo chart marks a sharp rise, and clicking the marker opens a plain-words explanation of why it moved.
Click a marked move to read why it happened · isolated demonstration data.

Big moves are marked for you

Open any stock and the largest jumps and drops are already marked on the chart. You don't need to know what to look for.
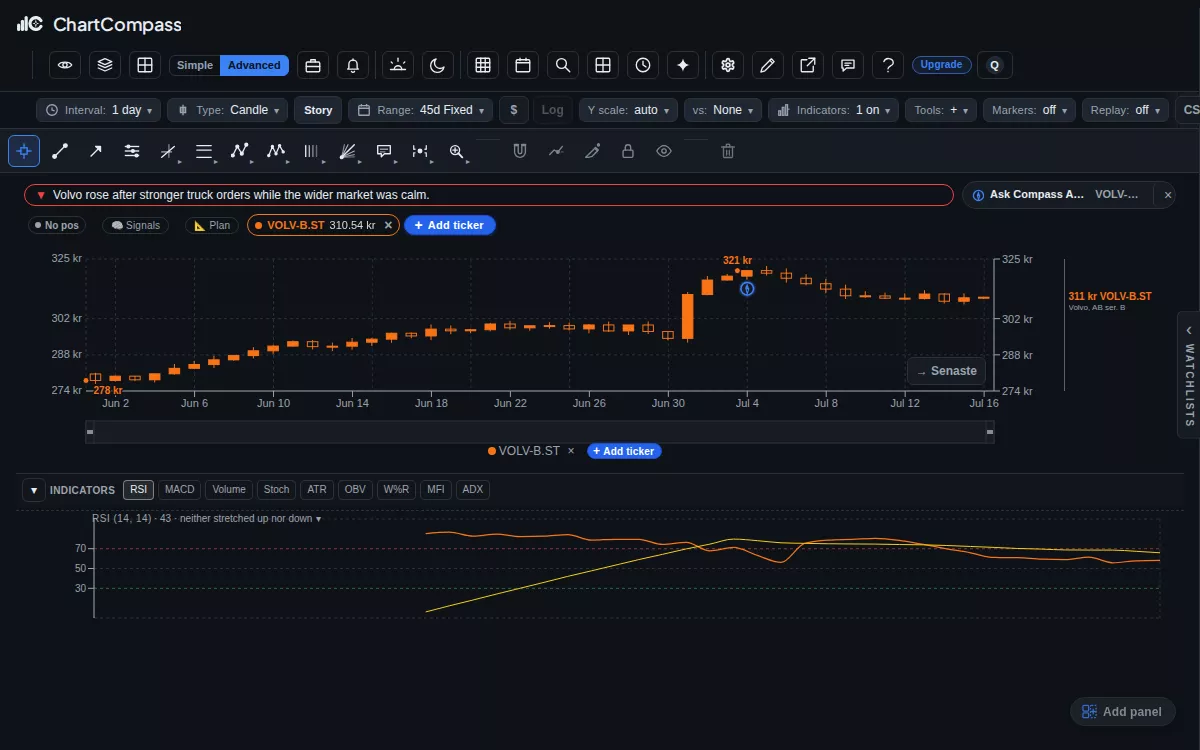
ChartCompass demonstration switching a Volvo chart from line to candles and adding the RSI indicator pane.
Switch chart types and add indicators in a click · isolated demonstration data.

Read what happened that day

Click a marker and a short card explains what was going on: results, company news, the sector or the wider market. When nothing clear explains a move, the card says so instead of guessing.
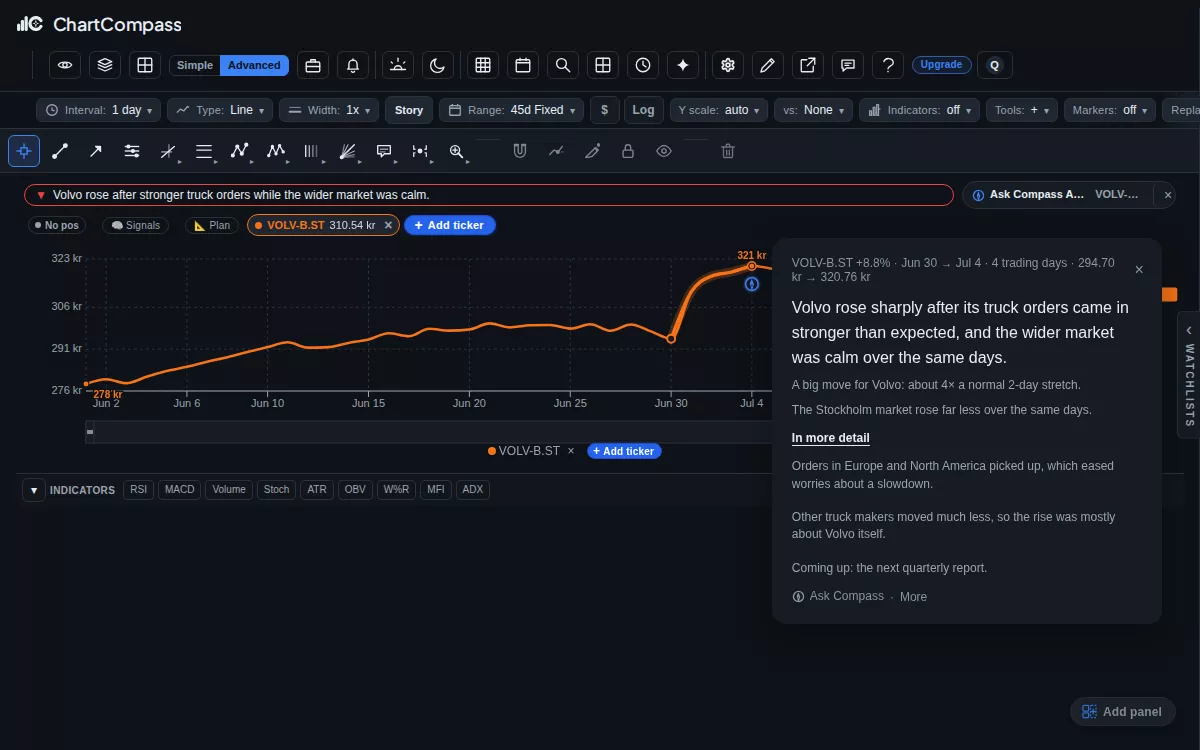
ChartCompass demonstration: a Volvo chart marks a sharp rise, and clicking the marker opens a plain-words explanation of why it moved.
Click a marked move to read why it happened · isolated demonstration data.

In your language, on your phone

Explanations come in English, Swedish, Norwegian, Danish and Finnish, for stocks on 14 exchanges including Stockholm, Oslo, Helsinki and Copenhagen.
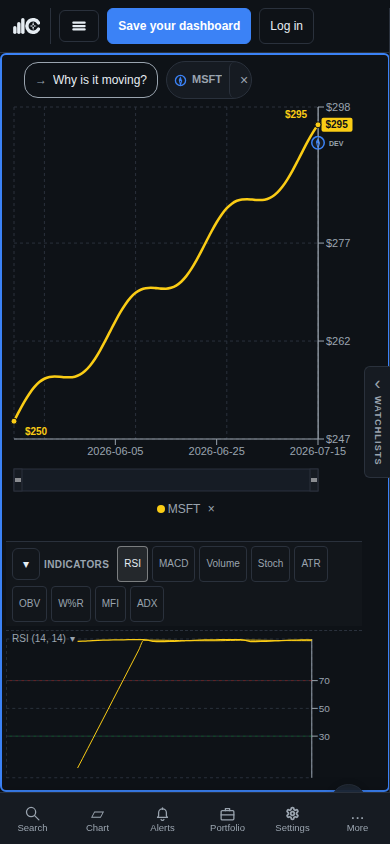
ChartCompass phone demonstration with a readable Volvo chart, a marked move, indicators, and compact bottom navigation.
The chart-first workspace remains usable on a phone-sized viewport.

Your stocks, every Saturday

Follow a few stocks and the weekly email explains their biggest moves of the week. See the weekly email
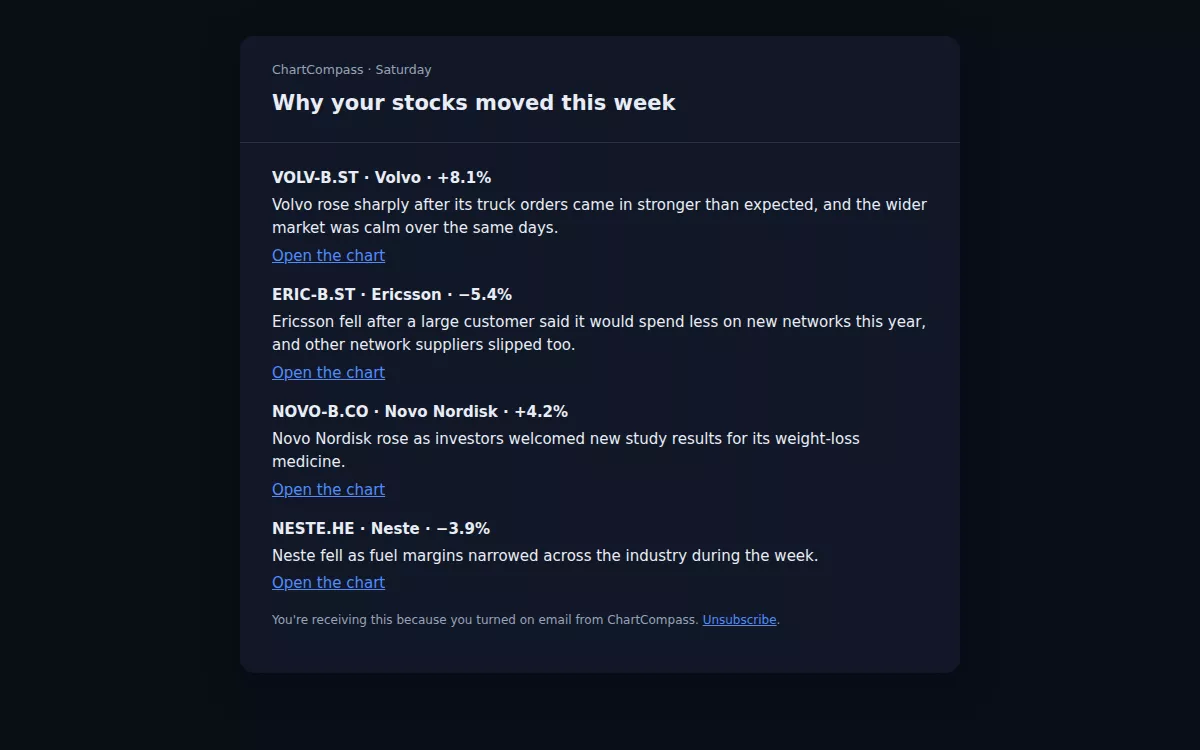
ChartCompass demonstration of the Saturday email explaining in plain words why each followed stock moved this week.
The Saturday email: why your stocks moved this week · demonstration data.

See why your stock moved

Free: every marker and explanation, for every stock. Essential: ask your own follow-up questions, 15 a day.

Open ChartCompass